Create Interactive Charts with ui-grid and Angular Chart

What we will do?
This tutorial will show you how to create a basic grid using ui-grid, and how to create charts with angular-chart.js. Further more, you will be shown how to link these two directives in order to obtain a unitary, user-responsive mechanism.
The goal is to build a user interactive grid with two reactive charts linked to its changes. More specifically the target is this (to see the magic, edit the values by double clicking on them): https://embed.plnkr.co/l7pcyGQi0UbwTQEtqypZ/
In order to keep things short and simple I will not build a sophisticated grid here, but I will give you some guidelines for detailed customization if needed.
After we finish building the grid, we will be testing the line and bars chart directives with a set of dummy data, then write a callback to sync the chart with the grid.
About AngularJS
AngularJS is a structural framework for dynamic web apps. It lets you use HTML as your template language and lets you extend HTML’s syntax to express your application’s components clearly and succinctly.
A detailed explanation on how to use Angular is beyond the scope of this discussion. If you are not using AngularJS already, you can find several AngularJS tutorials on the internet. You can start from the official AngularJS documentation page. Alternately, check out our articles about using custom validation directives or animating elements with Angular.
Angular UI Grid
UI Grid is a useful AngularJS native module which provides a complex and highly costumizable grid system. Grids are implemented natively in AngularJS so you don’t have any dependency for them, not even JQuery.
Here is a sneak peak of what UI-Grid can do:
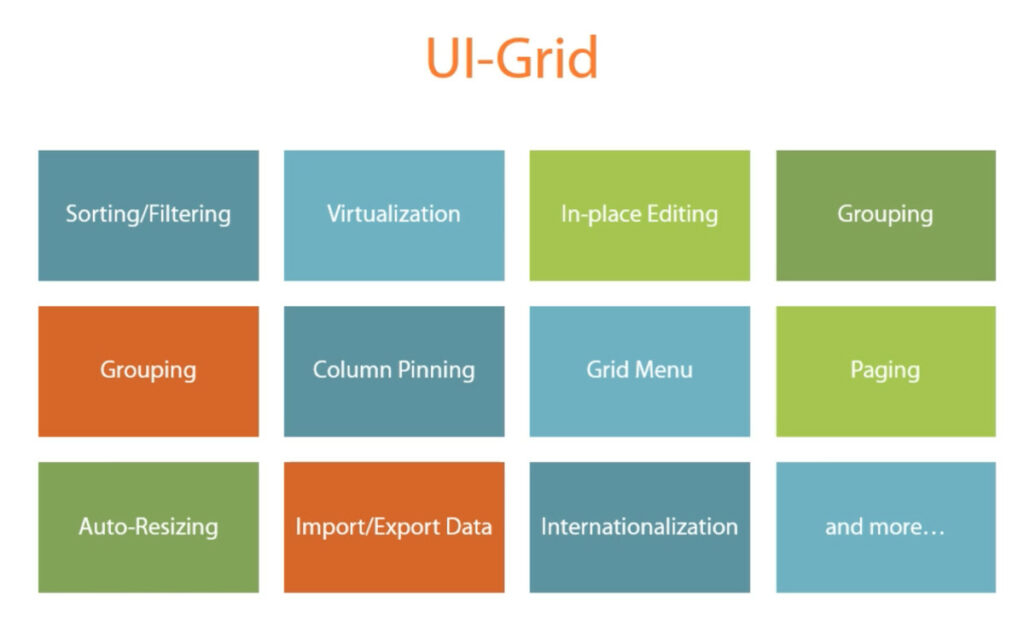
Features in UI-Grid are stored in separate modules. In order to enhance the grid with a new feature you simply have to declare the feature module as an Angular dependency and add the feature directive to your grid tag.
One of the most beautiful parts about UI-Grids is the permanent data synchronization between the graphical representation of the grid, which is interacting with the user, and the grid model behind the scenes.
Another useful feature is the simple but highly confortable binding mechanism between columns and row data which can make you life sweeter when you have to deal with aggregation of multiple grids.
In this tutorial we will demonstrate how to create our grid by using Angular UI-Grid.
Angular-chart
Angular-chart.js is another Angular module which allows you to create reactive, responsive, beautiful charts based on Chart.js.
Chart types available: line, bar, doughnut, radar, pie, dynamic, polar area.
Features:
- Same input data structure and attributes for each chart type directive
- Color and size are customizable
- Animations
- All charts are reactive when input changes
We will use this module to create our interactive charts.
Allright, let’s get some action!
In order to work with Angular you first need to import an Angular script. We will use AngularJS v1.4.7, ui-grid v3.0.7 and angular-chart.js v0.3.9.
Step 1. Import scripts
Add the following script imports to your main html page:
- For AngularJS
<script src="https://code.angularjs.org/1.4.7/angular.min.js"></script>
- For UI-Grid
<link rel="stylesheet" href="https://cdn.rawgit.com/angular-ui/bower-ui-grid/master/ui-grid.min.css"/>
<script src="https://cdn.rawgit.com/angular-ui/bower-ui-grid/master/ui-grid.min.js"></script>
- For angular-chart.js
<link rel="stylesheet" href="//cdn.jsdelivr.net/angular.chartjs/latest/angular-chart.css"/>
<script src="https://cdnjs.cloudflare.com/ajax/libs/Chart.js/1.0.2/Chart.min.js"></script>
<script src="//cdn.jsdelivr.net/angular.chartjs/latest/angular-chart.min.js"></script>
We will call the module tutorial and the script file tutorial.module.js, we will save the new script file in the current directory. For now, this module will have no dependencies. We will add them later.
(function mainModuleIIFE() {
  'use strict';
  angular.module('tutorial', []);
})();
Import the module script in your main html page.
<script src="tutorial.module.js"></script>
Step 3. Create an empty controller
We will call the controller tutorialCtrl and the script file tutorial.ctrl.js, we will save the new script file in the current directory.
(function tutorialCtrlIIFE() {
  'use strict';
  angular
      .module('tutorial')
      .controller('tutorialCtrl', tutorialCtrlFunc);
  function tutorialCtrlFunc() {
    var vm = this;
    return vm;
  }
})();
Import the controller script in your main html page.
<script src="tutorial.ctrl.js"></script>
Add ng-app=’tutorial’ and ng-controller=’tutorialCtrl as vm’ to your body tag.
Now you should have a basic functional angular app. You can address the controller properties with vm. property.
Extra: here is a plnkr link with the work done so far.
Step 4. Build the UI-Grid table
Ok, now we can make the grid working.
First, we need to add a ui.grid dependency to the main module tutorial. So our module declaration will look like this:
angular.module('tutorial', [
    'ui.grid'
]);
After that, we need to write our own column definitions for the grid. We will do this in the tutorialCtrl like this:
vm.columnDefs = [{
      field: 'Jan',
      name: 'January'
    }, {
      field: 'Feb',
      name: 'February'
    }, {
      field: 'Mar',
      name: 'March'
    }, {
      field: 'Apr',
      name: 'April'
    }];
As you may have already found out, each column is defined as an object with some properties on it. Each property is optional, but you do need a certain few ones in order to obtain a visible result on the grid.
The field property here will allow us to bind values to each cell from a certain row when we define it (we will do this later).
The name property contains the visible name of a column, which is displayed in the head of the grid.
You can define or alter as many columns you wish, at any time. The ui-grid system is very reactive and will adapt to the changes immediately.
Ok! Now we have our column blueprints, let’s fill in some data!
The content of a grid is stored as an array of objects (rows).
Each row contains pairs of field names from the column definitions and values attached to them. Yes! It’s that simple! And the greatest part is the fact that you can change the row properties and values at any time, and the changes will apply immediately.
Here are our rows deffinitions:
vm.gridData = [{
  Jan: 5,
  Feb: 20,
  Mar: 50,
  Apr: 15
}, {
  Jan: 15,
  Feb: 30,
  Mar: 20,
  Apr: 5
}, {
  Jan: 1,
  Feb: 5,
  Mar: 50
}, {
  Jan: 90,
  Feb: 30,
  Apr: 90
}];
Simple enough! We are just a few steps from seeing our grid.
Because ui-grid is a directive like all the others, it can accept input data by angular enhanced html attributes. We will build a gridOptions object on our tutorialCtrl which we will pass to the ui-grid directive in order for it to keep in touch with our needs.
Add this to the controller:
vm.gridOptions = {
    columnDefs: vm.columnDefs,
    data: vm.gridData
};
Step 5. Show the grid you have just built
In your HTML files body, add a <div> element with the ui-grid directive attached to it. In the same div where you put your directive, you must assign the gridOptions from the controller. Something like this:
<div ui-grid="vm.gridOptions" class="ui-grid-custom-class"></div>
Now why is that class there?
The answer it’s because most of the time you must set the width and height of the grid manually in order to see something.
Create a stylesheet.css file in the current directory and add the following code to it:
.ui-grid-custom-class {
    width: 100%,
    height: 150px
}
Import the stylesheet by adding the following line in your HTML header:
<link rel="stylesheet" href="stylesheet.css">
And voila! Now you should have your grid visible and working!
Extra: If you have encountered problems or you are too lazy to write this on your own here is a plnkr file to help you out.
Step 6. Integrate chart.js
Here we will see how you can use angular-chart.js in your app.
First of all make sure you have the following scripts include in your main html page. You should already have them from Step 1.
<link rel="stylesheet" href="//cdn.jsdelivr.net/angular.chartjs/latest/angular-chart.css"/>
<script src="https://cdnjs.cloudflare.com/ajax/libs/Chart.js/1.0.2/Chart.min.js"></script>
<script src="//cdn.jsdelivr.net/angular.chartjs/latest/angular-chart.min.js"></script>
Ok, now let’s make Angular know about this charts module.
1 . In the module file add ‘chart.js’ to module dependencies.
2 . In your main html file add two canvas tags like this:
<canvas class="chart chart-line chart-custom-class"
        chart-labels="vm.chartLabels"
        chart-data="vm.chartData"
        chart-lengend="true"
        chart-series="vm.chartSeries">
</canvas>
<canvas class="chart chart-bar chart-custom-class"
        chart-labels="vm.chartLabels"
        chart-data="vm.chartData"
        chart-lengend="true"
        chart-series="vm.chartSeries">
</canvas>
Maybe you have noticed that the values assigned to canvas attributes don’t exist at the moment. Well.. don’t worry. We will define them at once!
3 . Go the controller file and add the following dummy data:
For now, the grid data is hardcoded in order to make things simpler to understand, later we will generate chart data interactively from the grid columns.
vm.chartData = [[1, 4, 2, 4, 0, 3], [1, 0, 3, 0, 4, 1]];
vm.chartLabels = ['a', 'b', 'c', 'd', 'e', 'f'];
vm.chartSeries = ['line1', 'line2'];
Explanations:
- vm.chartData will be assigned to the chart-data attribute of the canvas. As you can see, this property is an array of arrays. The rule is simple: Each inner array contains a ordered series of vertical values for a given line. The outer array is just a container for the inner arrays. In this example we have 2 data lines in the chart.
- vm.chartLabels will be assigned to chart-labels. This is an array in which we will specify the names of the horizontal grid line nodes, in order.
- vm.chartSeries will be assigned to the chart-series attribute. This one is very simple, here you can give a name for each series of vertical values given in vm.chartData.
4 . Go to your style css file and add the following class:
.chart-custom-class {
  width: 100%;
  height: 250px;
}
If you followed the steps correctly, you should now have a demo chart! As you may already expect here is a Plnkr demo.
Now it’s time to start putting things together
1. Make the grid editable
Now that we a have a functional grid we only need to make its cells’ data editable.
The behaviour we wish to implement is:
- When the user double clicks on a cell, it should transform into an input field and allow the user to change its value.
We can do this by enhancing the grid element with another grid directive, called ui-grid-edit. The thing is that ui-grid keeps it’s major directives in separate modules, so we need to request the specifig module for this directive in our main module.
We can do this by adding ‘ui.grid.edit’ to the module dependencies list and then add the directive to the grid element. After this, your grid element should look like this:
<div ui-grid="vm.gridOptions" ui-grid-edit class="ui-grid-custom-class"></div>
Congratulations, now you have an editable grid! Easy enough, huh?
Extra
There is an option on the gridOptions object that dictates whether the cells are really editable or not. The options is called enableCellEdit and it’s default value is true. That is the reason we didn’t write anything on the gridOptions for this. If you want to disable editing you simply assign false to enableCellEdit and the effect will take.
2. Write a converter function from grid to chart data
Here we must write a callback function to be called every time the grid data changes, so we can get the responsive effect.
The function must convert the grid column values into an array of column sums. More exactly it will take each column one by one, go through all the rows and add the values corresponding to the current column into a sum variable.
The sums for each column in order will be gathered into an array which will represent a chart data set (a series of vertices unites by a line).
I wrote down an example here:
function convertGridDataIntoChart(columns, rows) {
  var sums = []; // the sum for each column will be pushed here
  var labels = []; // the name for each column will be pushed here
  var series = ['My reactive chart']; // names for the data series, here we have only one
  // for each column
  for (var i = 0, colsCnt = columns.length; i < colsCnt; i++) {
    var column = columns[i];
    // calculate sum on column
    sums[i] = getColumnSum(column, rows);
    // save the column name as chart label
    labels.push(column.name);
  }
  var chart = {
    data: [sums],
    labels: labels,
    series: series
  }
  applyChart(chart);
}
function getColumnSum(column) {
  var sum = 0;
  for (var i = 0, rowsCnt = vm.gridData.length; i < rowsCnt; i++) {
      var row = vm.gridData[i];
      var fieldName = column.field;
      if (row.hasOwnProperty(fieldName)) {
        sum += row[fieldName];
      }
  }
  return sum;
}
function applyChart(chart) {
  vm.chartData = chart.data;
  vm.chartLabels = chart.labels;
  vm.chartSeries = chart.series;
}
There is not much to explain: the convertGridDataIntoChart function receives the grid columns and rows data and creates a chart object. Then it calls the applyChart function, which maps the new data for our chart directive.
3. Attach converter function as callback to grid data change event
This is not a big deal, but you need to pay attention.
Every time a grid instance is created there is an API object available in order to change the grids state at runtime. You can get this API object by setting a callback function as parameter on vm.gridOptions like this.
vm.gridOptions = {
  ...,
  onRegisterApi: function (gridApi) {
  }
  ...
}
This callback takes place only once and if you need to use gridApi multiple times in your app you should save its reference somewhere on the model.
In our case, we need the API only once to register our callback function. This is done by calling registerDataChangeCallback from gridApi.grid with 2 parameters. First one is the function you want to be executed as callback, the other is an array of events on which you want it to be executed.
Ui-grid uses constants to replace event names so we need to inject uiGridConstants into our controller.
Having the constants object injected, now we can register the callback. The following piece of code must be added as property of vm.gridOptions.
onRegisterApi: function (gridApi) {
  gridApi.grid.registerDataChangeCallback(
    function() {
      convertGridDataIntoChart(vm.columnDefs, vm.gridData)
    },
    [uiGridConstants.dataChange.ALL]
  );
}
The event uiGridConstants.dataChange.ALL is fired every time a grid data change event takes place, no matter it is a new row/column added or a cell value changed.
4. Completely remove the charts dummy data set before
The applyChart function used to overwrite the dummy data set before, but there is no more use for it now.
Admire your work
Job done! Congratulations! Here is the final Plnkr file.
Optional
Improve cell interaction
Right now, the grid controls are quite annoying and mouse-intensive. Let’s make the grid controls fancier. We can do this very easily just by adding 2 more words into our app.
- Add ‘ui.grid.cellNav’ as module dependency.
- Add ui-grid-cellNav attribute to the grid div tag.
The ui-grid-cellNav directive greatly improves grid cells look & feel:
- current cell is always highlighted.
- adds navigation between columns using arrows and tab.
- automatically sets the current column into input field when a character is pressed.
That’s it! Here is the result Plnkr file.
Isn’t it amazing how fast you can add new features to your grid?
And it has all kinds of this modules for allmost everything you might need.
This is the power of Angular ui-grid.
I hope you enjoyed this tutorial. Good luck!
We transform challenges into digital experiences
Get in touch to let us know what you’re looking for. Our policy includes 14 days risk-free!
Free project consultation